12 Figure 2: Model output
We have now quantified uncertainty in our model using bootstrapping and can finally visualise the outcome.
12.1 Processing environment
library(ggplot2)
library(mboost)
library(dplyr)
library(tidyr)
library(magrittr)
library(patchwork)
library(ggdist)
library(MASS)
Once again we have tweaked some of the mboost default functionality, in this case to facilitate plotting using ggplot2.
12.2 Variable importance
We start by calculating summary statistics of bootstrapped variable importance, as we’ll organise the final figure according to descending variable importance.
bootstrapped_varimp <- function(modelci, exclude = c("dist_radar", "acov"), round = 0) {
  ind_vis <- lapply(modelci$varimp, function(x) {
    x %>%
      filter(!variable %in% exclude) %>%
      mutate(vi = reduction / sum(reduction) * 100)
  })
  vis_out <- ind_vis[[1]] %>%
    dplyr::select(variable, vi) %>%
    mutate(variable = as.character(variable))

  agg_vis <- lapply(ind_vis[2:length(ind_vis)], function(x) {
    x %>%
      dplyr::select(vi)
  })

  vis_out[2:length(ind_vis)] <- bind_cols(agg_vis)
  vis_out
}

bvi_biol <- bootstrapped_varimp(modelci)
bvi_all <- bootstrapped_varimp(modelci, exclude = NULL)
And we can plot the distribution of these variable importance measures for each of the predictors, for a model containing all predictors and one containing just biologically-relevant predictors. For the latter we have rescaled variable importance back to 100% after removal of dist_radar.
bvi_biol %>%
  pivot_longer(!variable, names_to = "bootstrap", values_to = "vi") %>%
  ggplot(aes(x = vi, y = variable)) +
  stat_eye() +
  labs(x = "Variable importance (%)", y = "Predictor", title = "Biologically-relevant predictors")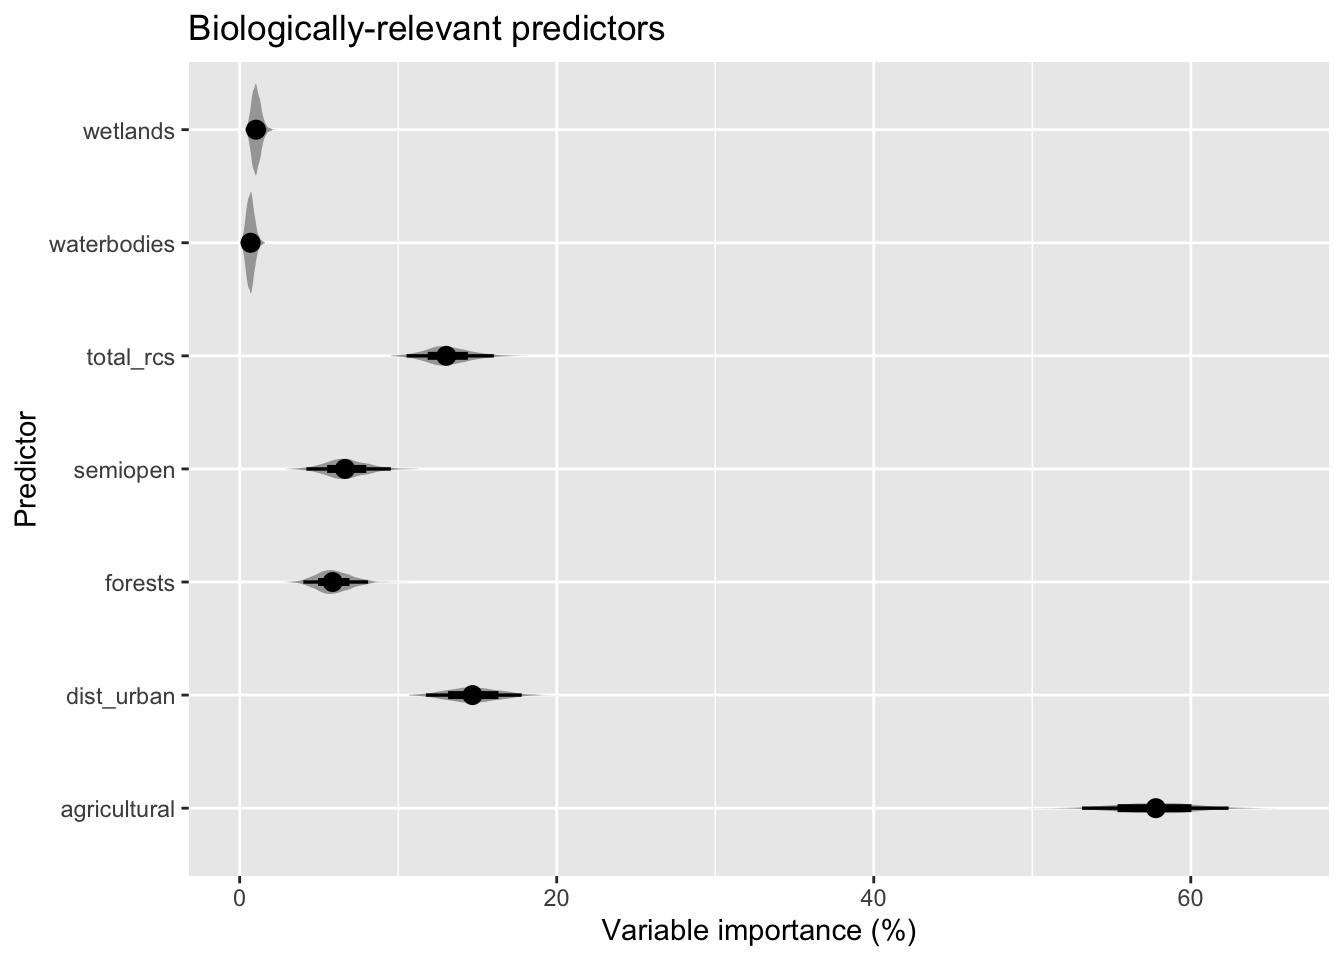
bvi_all %>%
  pivot_longer(!variable, names_to = "bootstrap", values_to = "vi") %>%
  ggplot(aes(x = vi, y = variable)) +
  stat_eye() +
  labs(x = "Variable importance (%)", y = "Predictor", title = "All model predictors")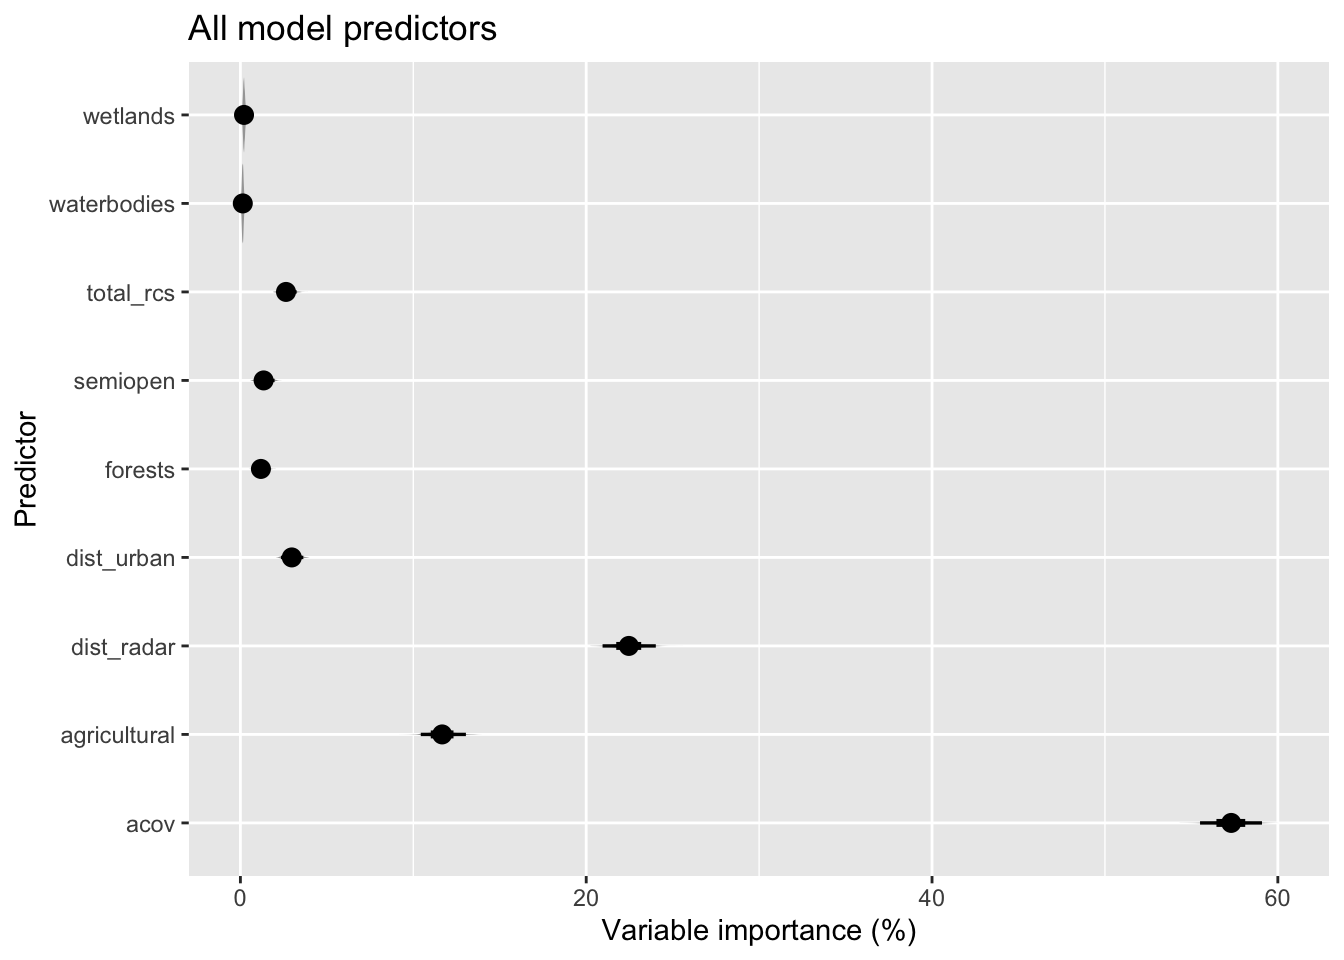
We can now also calculate the mean variable importance for each of the predictors to determine the rank in the final figure.
bvi_biol %>%
  pivot_longer(!variable, names_to = "bootstrap", values_to = "vi") %>%
  group_by(variable) %>%
  summarise(mean_vi = mean(vi), q025 = quantile(vi, probs = 0.025), q975 = quantile(vi, probs = 0.975), .groups = "drop_last") %>%
  mutate(mean_round = round(mean_vi, 0)) %>%
  arrange(desc(mean_vi)) -> bvi_biol

bvi_all %>%
  pivot_longer(!variable, names_to = "bootstrap", values_to = "vi") %>%
  group_by(variable) %>%
  summarise(mean_vi = mean(vi), q025 = quantile(vi, probs = 0.025), q975 = quantile(vi, probs = 0.975), .groups = "drop_last") %>%
  mutate(mean_round = round(mean_vi, 0)) %>%
  arrange(desc(mean_vi)) -> bvi_all

bvi_biol
bvi_all| variable | mean_vi | q025 | q975 | mean_round |
|---|---|---|---|---|
| agricultural | 57.7548679 | 53.1343876 | 62.384789 | 58 |
| dist_urban | 14.7228878 | 11.7484591 | 17.788836 | 15 |
| total_rcs | 13.1193902 | 10.5275230 | 16.032063 | 13 |
| semiopen | 6.7201888 | 4.2070031 | 9.538973 | 7 |
| forests | 5.9381210 | 4.0156491 | 8.093302 | 6 |
| wetlands | 1.0527471 | 0.5537306 | 1.675548 | 1 |
| waterbodies | 0.6917972 | 0.2450107 | 1.231014 | 1 |
| variable | mean_vi | q025 | q975 | mean_round |
|---|---|---|---|---|
| acov | 57.2999093 | 55.5008294 | 59.0830247 | 57 |
| dist_radar | 22.4759546 | 20.9457733 | 24.0241596 | 22 |
| agricultural | 11.6829366 | 10.4330351 | 13.0415245 | 12 |
| dist_urban | 2.9768141 | 2.3492067 | 3.6369542 | 3 |
| total_rcs | 2.6524443 | 2.1348919 | 3.2529700 | 3 |
| semiopen | 1.3599282 | 0.8326605 | 1.9754669 | 1 |
| forests | 1.1994243 | 0.8164663 | 1.6287635 | 1 |
| wetlands | 0.2128418 | 0.1136479 | 0.3365340 | 0 |
| waterbodies | 0.1397470 | 0.0481859 | 0.2495291 | 0 |
12.3 Compare groups
There’s quite some overlap in the confidence intervals, so let’s see which variables actually have different variable importance.
bvi_all %>%
  pivot_longer(!variable, names_to = "bootstrap", values_to = "vi") -> all

summary(aov(vi ~ variable, data = all))
pttest <- pairwise.t.test(all$vi, all$variable)
write.matrix(pttest$p.value, file = "data/models/varimp.pttest.csv", sep = ",")
pttest
## Df Sum Sq Mean Sq F value Pr(>F)
## variable 8 11300 1412.5 2164 <2e-16 ***
## Residuals 27 18 0.7
## ---
## Signif. codes: 0 '***' 0.001 '**' 0.01 '*' 0.05 '.' 0.1 ' ' 1
##
## Pairwise comparisons using t tests with pooled SD
##
## data: all$vi and all$variable
##
## acov agricultural dist_radar dist_urban forests semiopen
## agricultural < 2e-16 - - - - -
## dist_radar < 2e-16 1.4e-15 - - - -
## dist_urban < 2e-16 1.1e-13 < 2e-16 - - -
## forests < 2e-16 1.3e-15 < 2e-16 0.03822 - -
## semiopen < 2e-16 1.5e-15 < 2e-16 0.06126 1.00000 -
## total_rcs < 2e-16 6.1e-14 < 2e-16 1.00000 0.08410 0.12804
## waterbodies < 2e-16 < 2e-16 < 2e-16 0.00041 0.38295 0.33673
## wetlands < 2e-16 < 2e-16 < 2e-16 0.00049 0.38295 0.35385
## total_rcs waterbodies
## agricultural - -
## dist_radar - -
## dist_urban - -
## forests - -
## semiopen - -
## total_rcs - -
## waterbodies 0.00104 -
## wetlands 0.00125 1.00000
##
## P value adjustment method: holmIndeed, mean variable importance for dist_urban is not significantly different from total_rcs and the same applies to waterbodies and wetlands.
12.4 Visualise marginal effects
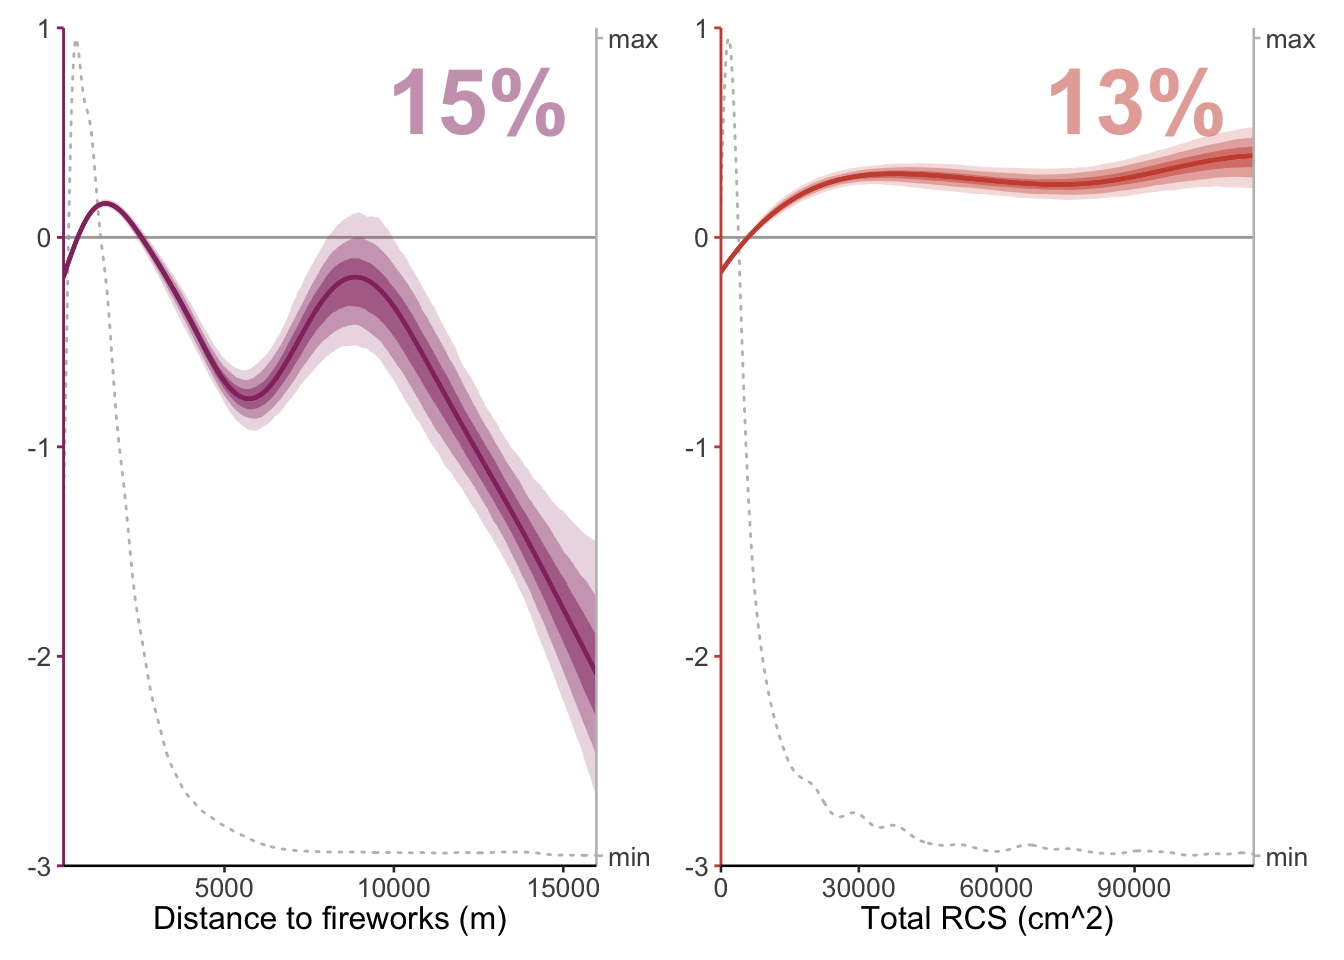
Now that we have calculated how the marginal effects should be ordered, we can generate the final plots.
12.4.1 Biologically-relevant marginal effects
confidence.intervals <- c(0.95, 0.8, 0.5)
colors <- c("urban" = "#94346E",
            "agricultural" = "#73AF48",
            "semiopen" = "#EDAD08",
            "forests" = "#0F8554",
            "wetlands" = "#38A6A5",
            "waterbodies" = "#1D6996",
            "dist_urban" = "#94346E",
            "total_rcs" = "#CC503E",
            "dist_radar" = "#666666")
x_labels <- c("urban" = "Urban",
              "agricultural" = "Agricultural",
              "semiopen" = "Semi-open",
              "forests" = "Forests",
              "wetlands" = "Wetlands",
              "waterbodies" = "Water bodies",
              "dist_urban" = "Distance to fireworks (m)",
              "total_rcs" = "Total RCS (g^(2/3))",
              "dist_radar" = "Distance from radar (m)")
limit_quantiles <- c("dist_urban", "total_rcs")
manual_limits <- list("dist_urban" = c(min(data_cleaned$dist_urban), max(data_cleaned$dist_urban)),
                      "total_rcs" = c(0, quantile(data_cleaned$total_rcs, probs = 0.975)))
# ylims <- c(-1.8, 1.5) + modelci$model$offset
ylims <- c(-1, 1)

plot_mboost_pdp <- function(modelci, data, which, confints, colors = NULL, ylims = ylims, varimp = NULL, offset = FALSE) {
  # Extract bootstrapped quantiles
  quants <- t(mboost_bootstrapped_quantiles(modelci, confidence.intervals, which = which))
  if (offset) quants <- quants + modelci$model$offset
  bootstrapped_quantiles <- as.data.frame(quants)
  # bootstrapped_quantiles <- as.data.frame(t(mboost_bootstrapped_quantiles(modelci, confidence.intervals, which = which)))
  bootstrapped_quantiles$x <- modelci$data[modelci$model$which(which)][[1]][, 1]
  bootstrapped_quantiles$y <- plot.mboost_adjusted(modelci$model, which = which, newdata = modelci$data[[modelci$model$which(which)]])[[2]]
  if (offset) {
    bootstrapped_quantiles$y <- bootstrapped_quantiles$y + modelci$model$offset
    ylims <- ylims + modelci$model$offset
  }

  p <- ggplot(bootstrapped_quantiles)
  i <- 1
  sorted_confints <- sort(confints, decreasing = TRUE)

  # Add variable importance
  if (is.null(varimp)) {
    variable_importance <- function(model, which, exclude = c("dist_radar"), round = 0) {
      vi <- as.data.frame(varimp(model)) %>%
        filter(!variable %in% exclude)
      vi$vi <- vi$reduction / sum(vi$reduction) * 100
      vi %>%
        filter(variable == which) %>%
        dplyr::select(vi) %>%
        as.numeric() %>%
        round(round)
    }
    vi <- variable_importance(modelci$model, which)
  } else {
    vi <- varimp %>%
      filter(variable == which) %>%
      dplyr::select(mean_round)
  }

  offset_right <- 0.95
  offset_top <- 0.35
  if (which == "dist_urban") {
    p <- p +
      annotate("text", x = manual_limits$dist_urban[[2]] * offset_right, y = ylims[2] - offset_top, label = paste0(vi, "%"), hjust = 1, color = colors[which],
               fontface = "bold", size = 12, alpha = 0.5)
  } else if(which == "total_rcs") {
    p <- p +
      annotate("text", x = manual_limits$total_rcs[[2]] * offset_right, y = ylims[2] - offset_top, label = paste0(vi, "%"), hjust = 1, color = colors[which],
               fontface = "bold", size = 12, alpha = 0.5)
  } else {
    p <- p +
      annotate("text", x = 1 * offset_right, y = ylims[2] - offset_top, label = paste0(vi, "%"), hjust = 1, color = colors[which],
               fontface = "bold", size = 12, alpha = 0.5)
  }

  # Add density
  if (which == "dist_urban") {
    dens <- density(data[, which], bw = 225, from = manual_limits$dist_urban[[1]], to = manual_limits$dist_urban[[2]])
  } else if (which == "total_rcs") {
    dens <- density(data[, which], bw = 2000, from = manual_limits$total_rcs[[1]], to = manual_limits$total_rcs[[2]])
  } else {
    dens <- density(data[, which], bw = 0.03556, from = 0, to = 1)
  }
  scale_lims <- c(ylims[1] + 0.05, ylims[2] - 0.05)
  dens$y <- scales::rescale(dens$y, to = scale_lims)
  dens <- as.data.frame(list(as.matrix(dens$x), as.matrix(dens$y)))
  colnames(dens) <- c("x", "y")
  p <- p +
    geom_line(aes(x = x, y = y), data =  dens, color = "grey50", lineend = "round", linetype = 3) +
    scale_y_continuous(sec.axis = sec_axis(~ ., name = "Predictor frequency", breaks = scale_lims, labels = c("min", "max")))

  ## Add horizontal line
  if (offset) {
    yintercept <- modelci$model$offset
  } else {
    yintercept <- 0
  }
  p <- p +
    geom_hline(yintercept = yintercept, col = "darkgrey")

  for (ci in sorted_confints) {
    alphas <- rev(factor(sorted_confints))
    ymax <- as.name(paste((1 - (1 - ci) / 2) * 100, "%", sep = ""))
    ymax <- enquo(ymax)
    ymin <- as.name(paste(((1 - ci) / 2) * 100, "%", sep = ""))
    ymin <- enquo(ymin)

    p <- p +
      geom_ribbon(aes(x = x, ymin = !!ymin, ymax = !!ymax, alpha = !!alphas[i]), fill = colors[which]) +
      geom_line(aes(x = x, y = y), color = colors[which], size = 0.75, lineend = "round")

    if (offset) {
      p <- p + scale_y_continuous(labels = function(x) {10^x})
    }

    i <- i + 1
  }

  p <- p +
    scale_alpha_discrete(range = c(0.2, 0.5)) +
    coord_cartesian(ylim = ylims, expand = FALSE) +
    guides(alpha = FALSE)

  if (which == "dist_urban") {
    xlabel <- x_labels[which]
    p <- p +
      coord_cartesian(xlim = manual_limits$dist_urban, ylim = ylims, expand = FALSE)
      # scale_x_continuous(breaks = c(0, 10000, 20000, 30000), labels = c(0, 10, 20, 30))
  } else if (which == "total_rcs") {
    xlabel <- x_labels[which]
    p <- p +
      coord_cartesian(xlim = manual_limits$total_rcs, ylim = ylims, expand = FALSE)
      # scale_x_continuous(breaks = c(250, 500, 750), labels = c(250*4, 500*4, 750*4))
  } else {
    xlabel <- paste("%", x_labels[which])
    p <- p +
      scale_x_continuous(breaks = c(0, 0.25, 0.5, 0.75, 1), labels = c("0%", "25%", "50%", "75%", "100%"))
  }

  p <- p +
    theme_classic(base_size = 10) +
    labs(x = xlabel, y = expression(paste("Flight response ", log[10], "(VIR)"))) +
    theme(axis.line.y.left = element_line(color = colors[which], size = 0.5),
          axis.line.y.right = element_line(color = "grey"),
          axis.ticks.y.left = element_line(color = colors[which], size = 0.5),
          axis.ticks.y.right = element_line(color = "grey"),
          axis.title.y = element_text())

  if (which(varimp$variable == which) %% 2 == 0) {
    p <- p +
      theme(axis.title.y.left = element_blank())
  } else {
    p <- p +
      theme(axis.title.y.right = element_blank())
  }

  if (!which %in% limit_quantiles) {
    p <- p +
      theme(axis.title.x = element_text(vjust = 0.5))
  }

  p
}

predictors <- bvi_biol$variable
plots <- mapply(function(predictors) {plot_mboost_pdp(modelci, data_cleaned, which = predictors, confidence.intervals, colors, ylims, bvi_biol,
                                                      offset = FALSE)},
                predictors = predictors,
                SIMPLIFY = FALSE)

p <- wrap_plots(plots, ncol = 2)

p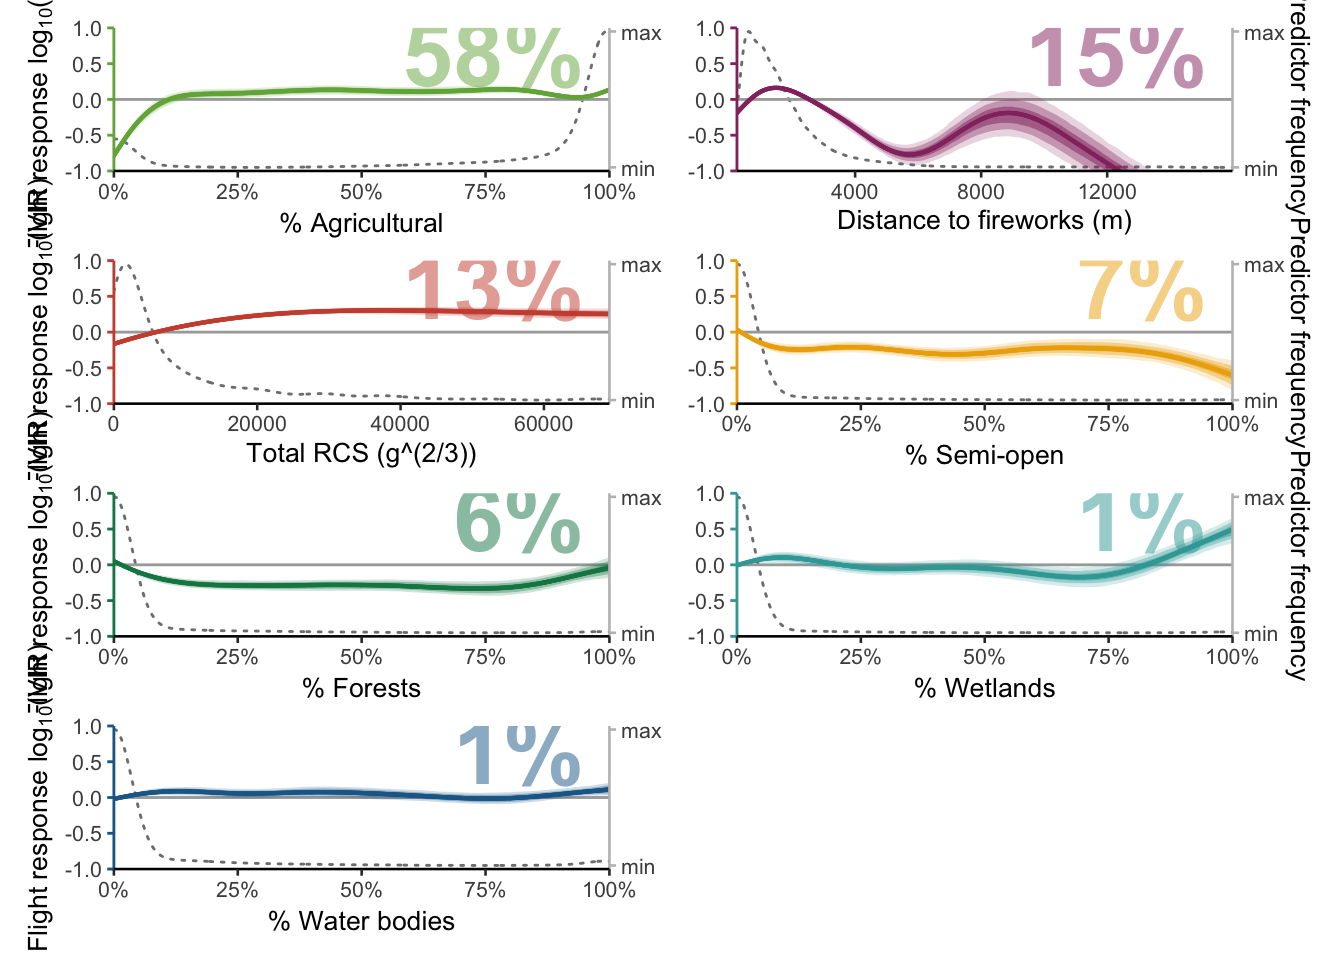
And we save it as a PDF so we can tweak the plot manually in Adobe Illustrator.
ggsave(filename = "data/plots/paper/fig2_biol.pdf", plot = p, width = 16, height = 20, dpi = 300, units = "cm")12.5 All marginal effects
confidence.intervals <- c(0.95, 0.8, 0.5)
colors <- c("urban" = "#94346E",
            "agricultural" = "#73AF48",
            "semiopen" = "#EDAD08",
            "forests" = "#0F8554",
            "wetlands" = "#38A6A5",
            "waterbodies" = "#1D6996",
            "dist_urban" = "#94346E",
            "total_rcs" = "#CC503E",
            "dist_radar" = "#666666",
            "acov" = "#666666")
x_labels <- c("urban" = "Urban",
              "agricultural" = "Agricultural",
              "semiopen" = "Semi-open",
              "forests" = "Forests",
              "wetlands" = "Wetlands",
              "waterbodies" = "Water bodies",
              "dist_urban" = "Distance to fireworks [m]",
              "total_rcs" = "Total RCS [cm^2]",
              "dist_radar" = "Distance from radar [m]",
              "acov" = "Residual autocovariate [cm^2]")
limit_quantiles <- c("dist_urban", "total_rcs")
manual_limits <- list("dist_urban" = c(min(data_cleaned$dist_urban), max(data_cleaned$dist_urban)),
                      "total_rcs" = c(0, max(data_cleaned$total_rcs)),
                      "dist_radar" = c(0, 66000))
# ylims <- c(-1.8, 1.5) + modelci$model$offset
ylims <- c(-1, 1)

plot_mboost_pdp <- function(modelci, data, which, confints, colors = NULL, ylims = ylims, varimp = NULL, offset = FALSE) {
  # Extract bootstrapped quantiles
  quants <- t(mboost_bootstrapped_quantiles(modelci, confidence.intervals, which = which))
  if (offset) quants <- quants + modelci$model$offset
  bootstrapped_quantiles <- as.data.frame(quants)
  # bootstrapped_quantiles <- as.data.frame(t(mboost_bootstrapped_quantiles(modelci, confidence.intervals, which = which)))
  bootstrapped_quantiles$x <- modelci$data[modelci$model$which(which)][[1]][, 1]
  bootstrapped_quantiles$y <- plot.mboost_adjusted(modelci$model, which = which, newdata = modelci$data[[modelci$model$which(which)]])[[2]]
  if (offset) {
    bootstrapped_quantiles$y <- bootstrapped_quantiles$y + modelci$model$offset
    ylims <- ylims + modelci$model$offset
  }

  p <- ggplot(bootstrapped_quantiles)
  i <- 1
  sorted_confints <- sort(confints, decreasing = TRUE)

  # Add variable importance
  if (is.null(varimp)) {
    variable_importance <- function(model, which, exclude = c("dist_radar"), round = 0) {
      vi <- as.data.frame(varimp(model)) %>%
        filter(!variable %in% exclude)
      vi$vi <- vi$reduction / sum(vi$reduction) * 100
      vi %>%
        filter(variable == which) %>%
        dplyr::select(vi) %>%
        as.numeric() %>%
        round(round)
    }
    vi <- variable_importance(modelci$model, which)
  } else {
    vi <- varimp %>%
      filter(variable == which) %>%
      dplyr::select(mean_round, q025, q975)
  }

  offset_right <- 0.95
  offset_top <- 0.35
  vi_string <- paste0(vi$mean_round, "% [", round(vi$q025, digits = 2), ";", round(vi$q975, digits = 2), "]")
  fontsize <- 6
  if (which == "dist_urban") {
    p <- p +
      annotate("text", x = manual_limits$dist_urban[[2]] * offset_right, y = ylims[2] - offset_top, label = vi_string, hjust = 1, color = colors[which],
               fontface = "bold", size = fontsize, alpha = 0.5)
  } else if(which == "total_rcs") {
    p <- p +
      annotate("text", x = manual_limits$total_rcs[[2]] * offset_right, y = 5 * (ylims[2] - offset_top), label = vi_string, hjust = 1, color = colors[which],
               fontface = "bold", size = fontsize, alpha = 0.5)
  } else if (which == "acov") {
    d <- model.frame(modelci$model)
    acov <- as.matrix(d[["bbs(acov)"]])
    p <- p +
      annotate("text", x = max(acov) * offset_right, y = 6.5 *(ylims[2] - offset_top), label = vi_string, hjust = 1, color = colors[which], fontface = "bold",
               size = fontsize, alpha = 0.5)
  } else if(which == "dist_radar") {
    p <- p +
      annotate("text", x = manual_limits$dist_radar[[2]] * offset_right, y = 2 *(ylims[2] - offset_top), label = vi_string, hjust = 1, color = colors[which],
               fontface = "bold", size = fontsize, alpha = 0.5)
  } else {
    p <- p +
      annotate("text", x = 1 * offset_right, y = ylims[2] - offset_top, label = vi_string, hjust = 1, color = colors[which],
               fontface = "bold", size = fontsize, alpha = 0.5)
  }

  # Add density
  if (which == "dist_urban") {
    dens <- density(data[, which], bw = 225, from = manual_limits$dist_urban[[1]], to = manual_limits$dist_urban[[2]])
  } else if (which == "total_rcs") {
    dens <- density(data[, which], bw = 2000, from = manual_limits$total_rcs[[1]], to = manual_limits$total_rcs[[2]])
  } else if (which == "acov") {
    d <- model.frame(modelci$model)
    acov <- as.matrix(d[["bbs(acov)"]])
    dens <- density(acov, from = min(acov), to = max(acov))
  } else if (which == "dist_radar") {
    dens <- density(data[, which], from = manual_limits$dist_radar[[1]], to = manual_limits$dist_radar[[2]])
  } else {
    dens <- density(data[, which], bw = 0.03556, from = 0, to = 1)
  }

  if (which == "dist_urban") { scale_lims <- c(-3 + 0.05, 1.5 - 0.05) }
  else if (which == "total_rcs") { scale_lims <- c(-8 + 0.05, 5 - 0.05) }
  else if (which == "dist_radar") { scale_lims <- c(-2 + 0.05, 2 - 0.05) }
  else if (which == "acov") { scale_lims <- c(-4 + 0.05, 6 - 0.05)}
  else {scale_lims <- c(ylims[1] + 0.05, ylims[2] - 0.05)}

  dens$y <- scales::rescale(dens$y, to = scale_lims)
  dens <- as.data.frame(list(as.matrix(dens$x), as.matrix(dens$y)))
  colnames(dens) <- c("x", "y")
  p <- p +
    geom_line(aes(x = x, y = y), data =  dens, color = "grey50", lineend = "round", linetype = 3) +
    scale_y_continuous(sec.axis = sec_axis(~ ., name = "Predictor frequency", breaks = scale_lims, labels = c("min", "max")))

  ## Add horizontal line
  if (offset) {
    yintercept <- modelci$model$offset
  } else {
    yintercept <- 0
  }
  p <- p +
    geom_hline(yintercept = yintercept, col = "darkgrey")

  for (ci in sorted_confints) {
    alphas <- rev(factor(sorted_confints))
    ymax <- as.name(paste((1 - (1 - ci) / 2) * 100, "%", sep = ""))
    ymax <- enquo(ymax)
    ymin <- as.name(paste(((1 - ci) / 2) * 100, "%", sep = ""))
    ymin <- enquo(ymin)

    p <- p +
      geom_ribbon(aes(x = x, ymin = !!ymin, ymax = !!ymax, alpha = !!alphas[i]), fill = colors[which]) +
      geom_line(aes(x = x, y = y), color = colors[which], size = 0.75, lineend = "round")

    if (offset) {
      p <- p + scale_y_continuous(labels = function(x) {10^x})
    }

    i <- i + 1
  }

  p <- p +
    scale_alpha_discrete(range = c(0.2, 0.5)) +
    coord_cartesian(ylim = ylims, expand = FALSE) +
    guides(alpha = FALSE)

  if (which == "dist_urban") {
    xlabel <- x_labels[which]
    p <- p +
      coord_cartesian(xlim = manual_limits$dist_urban, ylim = c(-3, 1.5), expand = FALSE)
      # scale_x_continuous(breaks = c(0, 10000, 20000, 30000), labels = c(0, 10, 20, 30))
  } else if (which == "total_rcs") {
    xlabel <- x_labels[which]
    p <- p +
      coord_cartesian(xlim = manual_limits$total_rcs, ylim = c(-8, 5), expand = FALSE)
      # scale_x_continuous(breaks = c(250, 500, 750), labels = c(250*4, 500*4, 750*4))
  } else if (which == "dist_radar") {
    xlabel <- x_labels[which]
    p <- p +
      coord_cartesian(ylim = c(-2, 2), expand = FALSE)
  } else if (which == "acov") {
    xlabel <- x_labels[which]
    p <- p +
      coord_cartesian(ylim = c(-4, 6), expand = FALSE, xlim = c(min(acov), max(acov)))
  } else {
    xlabel <- paste("%", x_labels[which])
    p <- p +
      scale_x_continuous(breaks = c(0, 0.25, 0.5, 0.75, 1), labels = c("0%", "25%", "50%", "75%", "100%"))
  }

  p <- p +
    theme_classic(base_size = 10) +
    labs(x = xlabel, y = expression(paste("Flight response ", log[10], "(VIR)"))) +
    theme(axis.line.y.left = element_line(color = colors[which], size = 0.5),
          axis.line.y.right = element_line(color = "grey"),
          axis.ticks.y.left = element_line(color = colors[which], size = 0.5),
          axis.ticks.y.right = element_line(color = "grey"),
          axis.title.y = element_text())

  if (which(varimp$variable == which) %% 2 == 0) {
    p <- p +
      theme(axis.title.y.left = element_blank())
  } else {
    p <- p +
      theme(axis.title.y.right = element_blank())
  }

  if (!which %in% limit_quantiles) {
    p <- p +
      theme(axis.title.x = element_text(vjust = 0.5))
  }

  p
}

predictors <- bvi_all$variable
plots <- mapply(function(predictors) {plot_mboost_pdp(modelci, data_cleaned, which = predictors, confidence.intervals, colors, ylims, bvi_all,
                                                      offset = FALSE)},
                predictors = predictors,
                SIMPLIFY = FALSE)

p <- wrap_plots(plots, ncol = 2)

p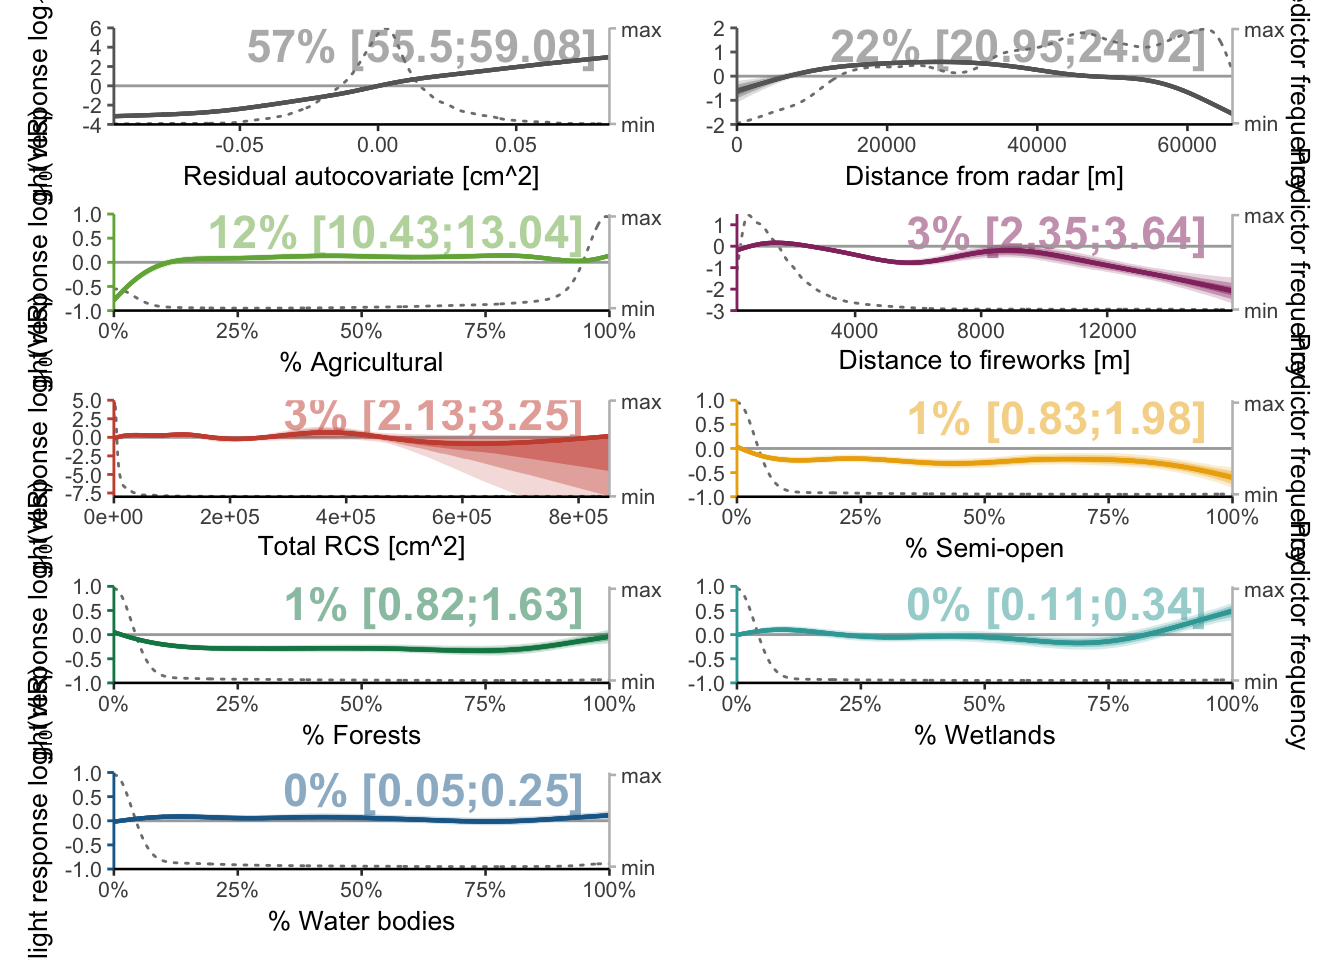
And once again we save the plot to PDF.
ggsave(filename = "data/plots/paper/fig2_all.pdf", plot = p, width = 16, height = 20, dpi = 300, units = "cm")12.6 Landscapes side-by-side
confidence.intervals <- c(0.95, 0.8, 0.5)
colors <- c("urban" = "#94346E",
            "agricultural" = "#73AF48",
            "semiopen" = "#EDAD08",
            "forests" = "#0F8554",
            "wetlands" = "#38A6A5",
            "waterbodies" = "#1D6996",
            "dist_urban" = "#94346E",
            "total_rcs" = "#CC503E",
            "dist_radar" = "#666666")
x_labels <- c("urban" = "Urban",
              "agricultural" = "Agricultural",
              "semiopen" = "Semi-open",
              "forests" = "Forests",
              "wetlands" = "Wetlands",
              "waterbodies" = "Water bodies",
              "dist_urban" = "Distance to fireworks (m)",
              "total_rcs" = "Total RCS (g^(2/3))",
              "dist_radar" = "Distance from radar (m)")
limit_quantiles <- c("dist_urban", "total_rcs")
manual_limits <- list("dist_urban" = c(min(data_cleaned$dist_urban), quantile(data_cleaned$dist_urban, probs = 0.975)),
                      "total_rcs" = c(0, quantile(data_cleaned$total_rcs, probs = 0.975)))
# ylims <- c(-1.8, 1.5) + modelci$model$offset
ylims <- c(-1, 1)

plot_mboost_pdp <- function(modelci, data, which, confints, colors = NULL, ylims = ylims, varimp = NULL, offset = FALSE) {
  # Extract bootstrapped quantiles
  quants <- t(mboost_bootstrapped_quantiles(modelci, confidence.intervals, which = which))
  if (offset) quants <- quants + modelci$model$offset
  bootstrapped_quantiles <- as.data.frame(quants)
  # bootstrapped_quantiles <- as.data.frame(t(mboost_bootstrapped_quantiles(modelci, confidence.intervals, which = which)))
  bootstrapped_quantiles$x <- modelci$data[modelci$model$which(which)][[1]][, 1]
  bootstrapped_quantiles$y <- plot.mboost_adjusted(modelci$model, which = which, newdata = modelci$data[[modelci$model$which(which)]])[[2]]
  if (offset) {
    bootstrapped_quantiles$y <- bootstrapped_quantiles$y + modelci$model$offset
    ylims <- ylims + modelci$model$offset
  }

  p <- ggplot(bootstrapped_quantiles)
  i <- 1
  sorted_confints <- sort(confints, decreasing = TRUE)

  # Add variable importance
  if (is.null(varimp)) {
    variable_importance <- function(model, which, exclude = c("dist_radar"), round = 0) {
      vi <- as.data.frame(varimp(model)) %>%
        filter(!variable %in% exclude)
      vi$vi <- vi$reduction / sum(vi$reduction) * 100
      vi %>%
        filter(variable == which) %>%
        dplyr::select(vi) %>%
        as.numeric() %>%
        round(round)
    }
    vi <- variable_importance(modelci$model, which)
  } else {
    vi <- varimp %>%
      filter(variable == which) %>%
      dplyr::select(mean_round)
  }

  offset_right <- 0.95
  offset_top <- 0.35
  if (which == "dist_urban") {
    p <- p +
      annotate("text", x = manual_limits$dist_urban[[2]] * offset_right, y = ylims[2] - offset_top, label = paste0(vi, "%"), hjust = 1, color = colors[which],
               fontface = "bold", size = 12, alpha = 0.5)
  } else if(which == "total_rcs") {
    p <- p +
      annotate("text", x = manual_limits$total_rcs[[2]] * offset_right, y = ylims[2] - offset_top, label = paste0(vi, "%"), hjust = 1, color = colors[which],
               fontface = "bold", size = 12, alpha = 0.5)
  } else {
    p <- p +
      annotate("text", x = 1 * offset_right, y = ylims[2] - offset_top, label = paste0(x_labels[which], ": ", vi, "%"), hjust = 1, color = colors[which],
               fontface = "bold", size = 12, alpha = 0.5)
  }

  # Add density
  if (which == "dist_urban") {
    dens <- density(data[, which], bw = 225, from = manual_limits$dist_urban[[1]], to = manual_limits$dist_urban[[2]])
  } else if (which == "total_rcs") {
    dens <- density(data[, which], bw = 2000, from = manual_limits$total_rcs[[1]], to = manual_limits$total_rcs[[2]])
  } else {
    dens <- density(data[, which], bw = 0.03556, from = 0, to = 1)
  }
  scale_lims <- c(ylims[1] + 0.05, ylims[2] - 0.05)
  dens$y <- scales::rescale(dens$y, to = scale_lims)
  dens <- as.data.frame(list(as.matrix(dens$x), as.matrix(dens$y)))
  colnames(dens) <- c("x", "y")
  p <- p +
    geom_line(aes(x = x, y = y), data =  dens, color = "grey", lineend = "round", linetype = 3) +
    scale_y_continuous(sec.axis = sec_axis(~ ., name = "Predictor frequency", breaks = scale_lims, labels = c("min", "max")))

  ## Add horizontal line
  if (offset) {
    yintercept <- modelci$model$offset
  } else {
    yintercept <- 0
  }
  p <- p +
    geom_hline(yintercept = yintercept, col = "darkgrey")

  for (ci in sorted_confints) {
    alphas <- rev(factor(sorted_confints))
    ymax <- as.name(paste((1 - (1 - ci) / 2) * 100, "%", sep = ""))
    ymax <- enquo(ymax)
    ymin <- as.name(paste(((1 - ci) / 2) * 100, "%", sep = ""))
    ymin <- enquo(ymin)

    p <- p +
      geom_ribbon(aes(x = x, ymin = !!ymin, ymax = !!ymax, alpha = !!alphas[i]), fill = colors[which]) +
      geom_line(aes(x = x, y = y), color = colors[which], size = 0.75, lineend = "round")

    if (offset) {
      p <- p + scale_y_continuous(labels = function(x) {10^x})
    }

    i <- i + 1
  }

  p <- p +
    scale_alpha_discrete(range = c(0.2, 0.5)) +
    coord_cartesian(ylim = ylims, expand = FALSE) +
    guides(alpha = FALSE)

  if (which == "dist_urban") {
    xlabel <- x_labels[which]
    p <- p +
      coord_cartesian(xlim = manual_limits$dist_urban, ylim = ylims, expand = FALSE)
      # scale_x_continuous(breaks = c(0, 10000, 20000, 30000), labels = c(0, 10, 20, 30))
  } else if (which == "total_rcs") {
    xlabel <- x_labels[which]
    p <- p +
      coord_cartesian(xlim = manual_limits$total_rcs, ylim = ylims, expand = FALSE)
      # scale_x_continuous(breaks = c(250, 500, 750), labels = c(250*4, 500*4, 750*4))
  } else {
    xlabel <- paste("% Coverage")
    p <- p +
      scale_x_continuous(breaks = c(0, 0.25, 0.5, 0.75, 1), labels = c("0%", "25%", "50%", "75%", "100%"))
  }

  p <- p +
    theme_classic(base_size = 10) +
    labs(x = xlabel, y = expression(paste("Flight response ", log[10], "(VIR)"))) +
    theme(axis.line.y.left = element_line(color = colors[which], size = 0.5),
          axis.line.y.right = element_line(color = "grey"),
          axis.ticks.y.left = element_line(color = colors[which], size = 0.5),
          axis.ticks.y.right = element_line(color = "grey"),
          axis.title.y = element_text(),
          axis.title.y.right = element_blank())

  if (!which == "forests") {
    p <- p +
      theme(axis.title.y.left = element_blank())
  }

  if (!which == "waterbodies") {
    p <- p +
      theme(axis.title.x = element_blank())
  }

  p
}

predictors <- c("agricultural", "semiopen", "forests", "wetlands", "waterbodies")
plots <- mapply(function(predictors) {plot_mboost_pdp(modelci, data_cleaned, which = predictors, confidence.intervals, colors, ylims, bvi_biol,
                                                      offset = FALSE)},
                predictors = predictors,
                SIMPLIFY = FALSE)

saveRDS(plots, file = "data/plots/paper/fig_landscapes.RDS")

p <- wrap_plots(plots, ncol = 1)

p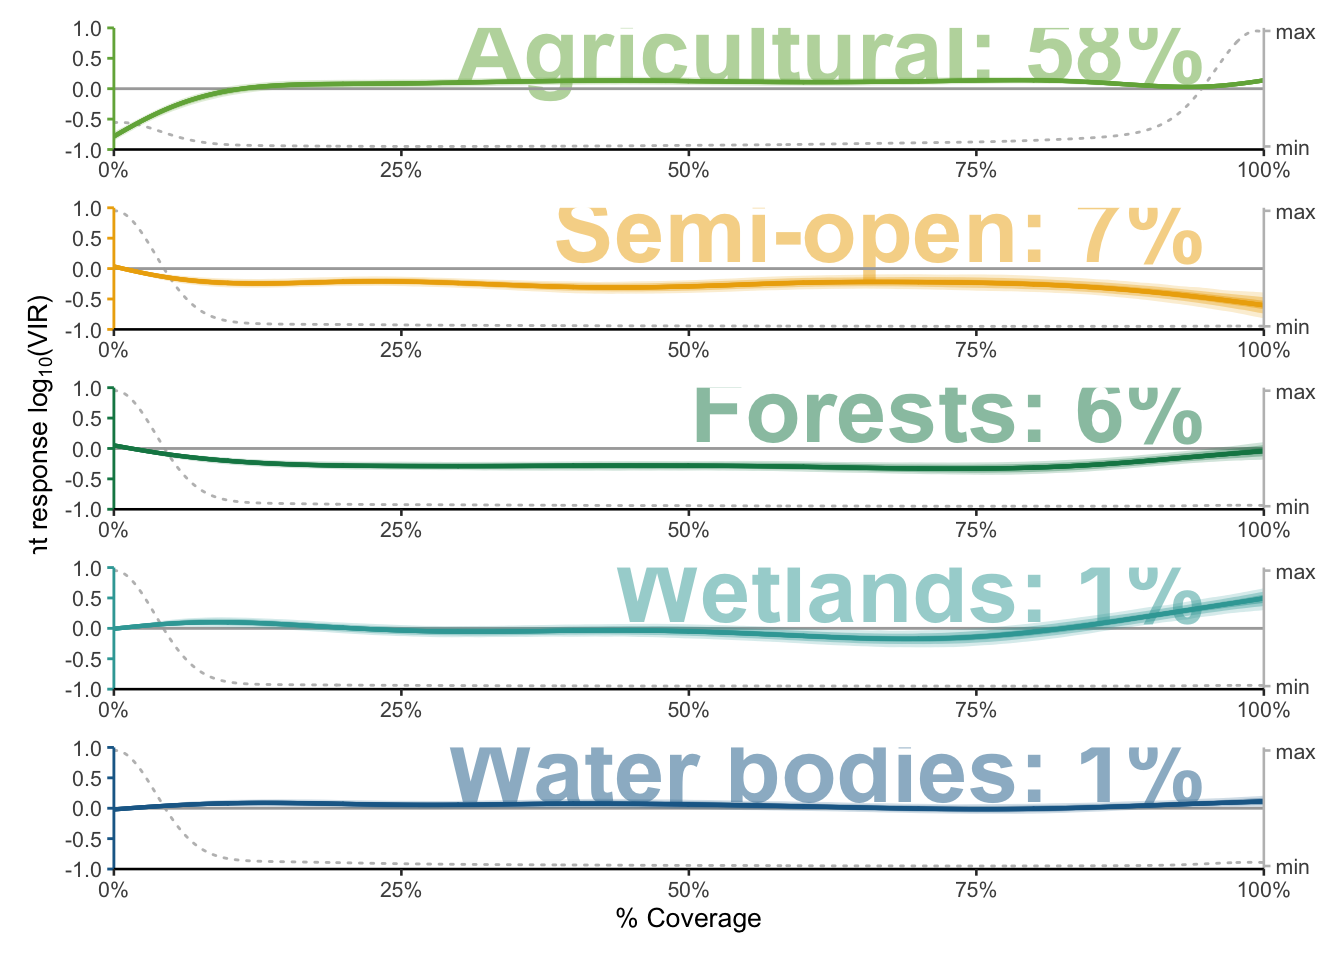
12.7 Pseudo-RCS & Distance to fireworks
confidence.intervals <- c(0.95, 0.8, 0.5)
colors <- c("urban" = "#94346E",
            "agricultural" = "#73AF48",
            "semiopen" = "#EDAD08",
            "forests" = "#0F8554",
            "wetlands" = "#38A6A5",
            "waterbodies" = "#1D6996",
            "dist_urban" = "#94346E",
            "total_rcs" = "#CC503E",
            "dist_radar" = "#666666")
x_labels <- c("urban" = "Urban",
              "agricultural" = "Agricultural",
              "semiopen" = "Semi-open",
              "forests" = "Forests",
              "wetlands" = "Wetlands",
              "waterbodies" = "Water bodies",
              "dist_urban" = "Distance to fireworks (m)",
              "total_rcs" = "Total RCS (cm^2)",
              "dist_radar" = "Distance from radar (m)")
limit_quantiles <- c("dist_urban", "total_rcs")
manual_limits <- list("dist_urban" = c(min(data_cleaned$dist_urban), max(data_cleaned$dist_urban)),
                      "total_rcs" = c(0, quantile(data_cleaned$total_rcs, probs = 0.995)))
# ylims <- c(-1.8, 1.5) + modelci$model$offset
ylims <- c(-3, 1)

plot_mboost_pdp <- function(modelci, data, which, confints, colors = NULL, ylims = ylims, varimp = NULL, offset = FALSE) {
  # Extract bootstrapped quantiles
  quants <- t(mboost_bootstrapped_quantiles(modelci, confidence.intervals, which = which))
  if (offset) quants <- quants + modelci$model$offset
  bootstrapped_quantiles <- as.data.frame(quants)
  # bootstrapped_quantiles <- as.data.frame(t(mboost_bootstrapped_quantiles(modelci, confidence.intervals, which = which)))
  bootstrapped_quantiles$x <- modelci$data[modelci$model$which(which)][[1]][, 1]
  bootstrapped_quantiles$y <- plot.mboost_adjusted(modelci$model, which = which, newdata = modelci$data[[modelci$model$which(which)]])[[2]]
  if (offset) {
    bootstrapped_quantiles$y <- bootstrapped_quantiles$y + modelci$model$offset
    ylims <- ylims + modelci$model$offset
  }

  p <- ggplot(bootstrapped_quantiles)
  i <- 1
  sorted_confints <- sort(confints, decreasing = TRUE)

  # Add variable importance
  if (is.null(varimp)) {
    variable_importance <- function(model, which, exclude = c("dist_radar"), round = 0) {
      vi <- as.data.frame(varimp(model)) %>%
        filter(!variable %in% exclude)
      vi$vi <- vi$reduction / sum(vi$reduction) * 100
      vi %>%
        filter(variable == which) %>%
        dplyr::select(vi) %>%
        as.numeric() %>%
        round(round)
    }
    vi <- variable_importance(modelci$model, which)
  } else {
    vi <- varimp %>%
      filter(variable == which) %>%
      dplyr::select(mean_round)
  }

  offset_right <- 0.95
  offset_top <- 0.35
  if (which == "dist_urban") {
    p <- p +
      annotate("text", x = manual_limits$dist_urban[[2]] * offset_right, y = ylims[2] - offset_top, label = paste0(vi, "%"), hjust = 1, color = colors[which],
               fontface = "bold", size = 12, alpha = 0.5)
  } else if(which == "total_rcs") {
    p <- p +
      annotate("text", x = manual_limits$total_rcs[[2]] * offset_right, y = ylims[2] - offset_top, label = paste0(vi, "%"), hjust = 1, color = colors[which],
               fontface = "bold", size = 12, alpha = 0.5)
  } else {
    p <- p +
      annotate("text", x = 1 * offset_right, y = ylims[2] - offset_top, label = paste0(x_labels[which], ": ", vi, "%"), hjust = 1, color = colors[which],
               fontface = "bold", size = 12, alpha = 0.5)
  }

  # Add density
  if (which == "dist_urban") {
    dens <- density(data[, which], bw = 225, from = manual_limits$dist_urban[[1]], to = manual_limits$dist_urban[[2]])
  } else if (which == "total_rcs") {
    dens <- density(data[, which], bw = 2000, from = manual_limits$total_rcs[[1]], to = manual_limits$total_rcs[[2]])
  } else {
    dens <- density(data[, which], bw = 0.03556, from = 0, to = 1)
  }
  scale_lims <- c(ylims[1] + 0.05, ylims[2] - 0.05)
  dens$y <- scales::rescale(dens$y, to = scale_lims)
  dens <- as.data.frame(list(as.matrix(dens$x), as.matrix(dens$y)))
  colnames(dens) <- c("x", "y")
  p <- p +
    geom_line(aes(x = x, y = y), data =  dens, color = "grey", lineend = "round", linetype = 3) +
    scale_y_continuous(sec.axis = sec_axis(~ ., name = "Predictor frequency", breaks = scale_lims, labels = c("min", "max")))

  ## Add horizontal line
  if (offset) {
    yintercept <- modelci$model$offset
  } else {
    yintercept <- 0
  }
  p <- p +
    geom_hline(yintercept = yintercept, col = "darkgrey")

  for (ci in sorted_confints) {
    alphas <- rev(factor(sorted_confints))
    ymax <- as.name(paste((1 - (1 - ci) / 2) * 100, "%", sep = ""))
    ymax <- enquo(ymax)
    ymin <- as.name(paste(((1 - ci) / 2) * 100, "%", sep = ""))
    ymin <- enquo(ymin)

    p <- p +
      geom_ribbon(aes(x = x, ymin = !!ymin, ymax = !!ymax, alpha = !!alphas[i]), fill = colors[which]) +
      geom_line(aes(x = x, y = y), color = colors[which], size = 0.75, lineend = "round")

    if (offset) {
      p <- p + scale_y_continuous(labels = function(x) {10^x})
    }

    i <- i + 1
  }

  p <- p +
    scale_alpha_discrete(range = c(0.2, 0.5)) +
    coord_cartesian(ylim = ylims, expand = FALSE) +
    guides(alpha = FALSE)

  if (which == "dist_urban") {
    xlabel <- x_labels[which]
    p <- p +
      coord_cartesian(xlim = manual_limits$dist_urban, ylim = ylims, expand = FALSE) +
      scale_x_continuous(breaks = c(0, 5000, 10000, 15000))
  } else if (which == "total_rcs") {
    xlabel <- x_labels[which]
    p <- p +
      coord_cartesian(xlim = manual_limits$total_rcs, ylim = ylims, expand = FALSE)
      # scale_x_continuous(breaks = c(250, 500, 750), labels = c(250*4, 500*4, 750*4))
  } else {
    xlabel <- paste("% Coverage")
    p <- p +
      scale_x_continuous(breaks = c(0, 0.25, 0.5, 0.75, 1), labels = c("0%", "25%", "50%", "75%", "100%"))
  }

  p <- p +
    theme_classic(base_size = 10) +
    labs(x = xlabel, y = expression(paste("Flight response ", log[10], "(VIR)"))) +
    theme(axis.line.y.left = element_line(color = colors[which], size = 0.5),
          axis.line.y.right = element_line(color = "grey"),
          axis.ticks.y.left = element_line(color = colors[which], size = 0.5),
          axis.ticks.y.right = element_line(color = "grey"),
          axis.title.y = element_text(),
          axis.title.y.right = element_blank())

  if (!which == "forests") {
    p <- p +
      theme(axis.title.y.left = element_blank())
  }

  if (!which == "waterbodies") {
    p <- p +
      theme(axis.title.x = element_blank())
  }

  p
}

predictors <- c("dist_urban", "total_rcs")
plots <- mapply(function(predictors) {plot_mboost_pdp(modelci, data_cleaned, which = predictors, confidence.intervals, colors, ylims, bvi_biol,
                                                      offset = FALSE)},
                predictors = predictors,
                SIMPLIFY = FALSE)

saveRDS(plots, file = "data/plots/paper/fig_rcs_disturban.RDS")

plots[[1]] + plots[[2]] +
plot_layout(widths = c(1, 1), nrow = 1) &
theme(axis.text.x = element_text(size = 10),
      axis.title.x = element_text(size = 12),
      axis.text.y = element_text(size = 10)) -> plots_rcs_disturban

ggsave(filename = "data/plots/paper/fig_rcs_disturban.pdf", plot = plots_rcs_disturban, width = 14, height = 5, dpi = 300, units = "cm")

plots_rcs_disturban