9 Environmental variables
data_stars <- readRDS("data/processed/data_stars.RDS")

as.data.frame(data_stars) %>%
  `colnames<-`(c("x", "y", "variable", "value")) %>%
  pivot_wider(names_from = variable, values_from = value) %>%
  mutate(tm_resid = rowMeans(dplyr::select(., tmmn_resid, tmmx_resid)),
         tm_trend = rowMeans(dplyr::select(., tmmn_trend, tmmx_trend))) %>%
  as.data.frame() %>%
  identity() -> data

africa <- st_read("data/raw/Africa.gpkg")
## Reading layer `Africa-Dissolved' from data source `/mnt/envirpred/raw/Africa.gpkg' using driver `GPKG'
## Simple feature collection with 1 feature and 2 fields
## geometry type: MULTIPOLYGON
## dimension: XY
## bbox: xmin: -25.3618 ymin: -50.01889 xmax: 77.60327 ymax: 37.55986
## CRS: 4326
data_base <- data

data %>%
  filter(Afrotropic == 1 & count_long >= 5) -> data

xlims <- c(-20, 50)
ylims <- c(-40, 40)
xbreaks <- c(-20, 0, 20, 40)
range01 <- function(x, ...){(x - min(x, ...)) / (max(x, ...) - min(x, ...))}
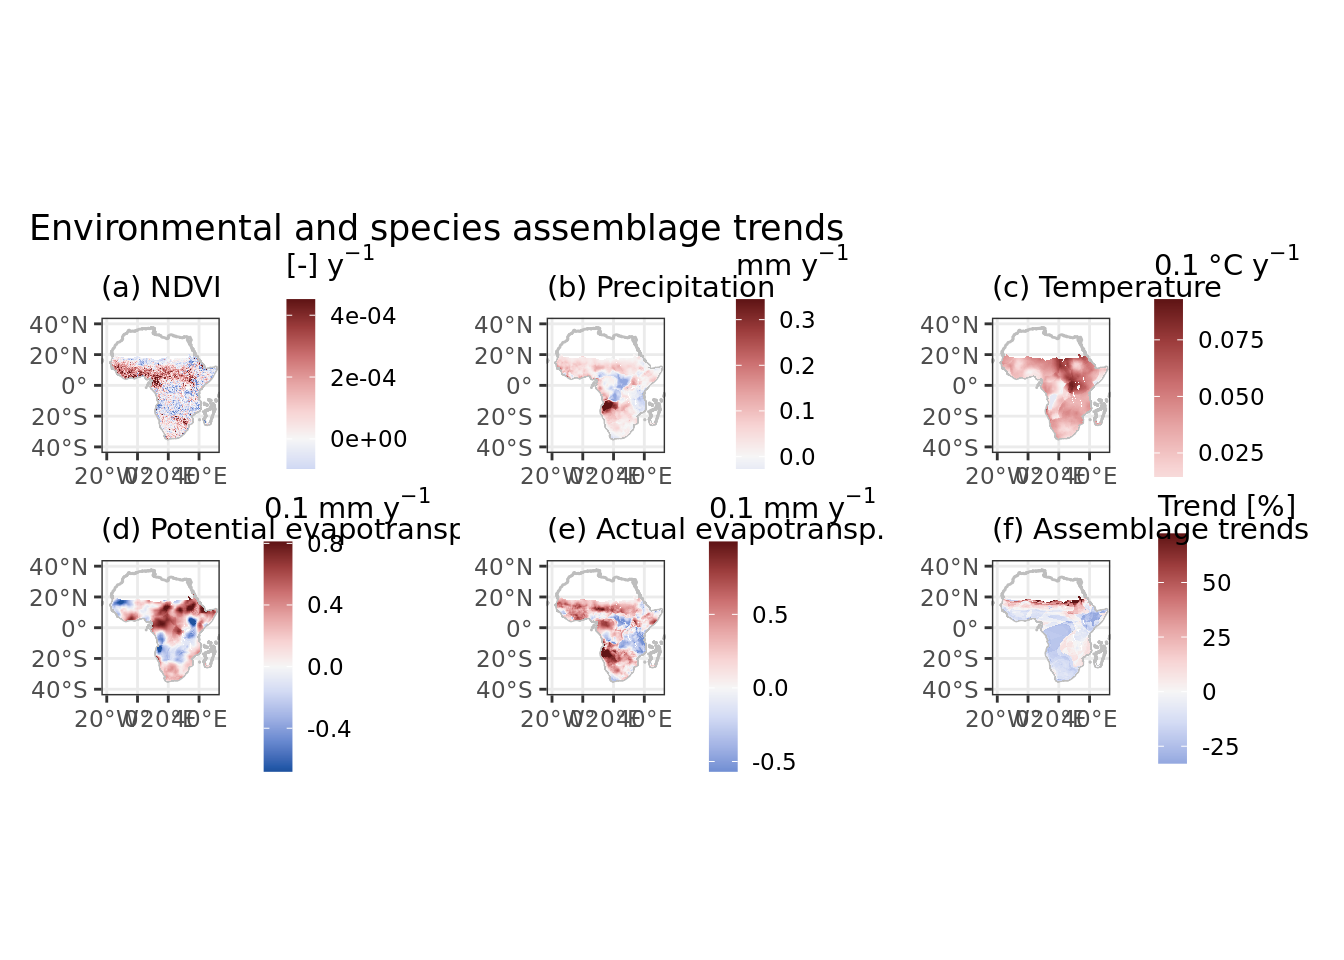
9.1 Environmental long-term trends
Color scales are mapped to (ie limited by) 1% and 99% quantiles, but for now I seem unable to calculate this on the fly in ggplot so these values are hard-coded and should be changed manually when the dataset changes.
ggplot(data) +
  geom_sf(data = africa, colour = "grey", fill = NA, alpha = 0.5) +
  geom_raster(aes(x = x, y = y, fill = ndvi_trend)) +
  scale_fill_continuous_diverging(limits = c(-0.0002917907, 0.0004510269),
                                  oob = scales::squish, na.value = NA, palette = "Blue-Red 3") +
  coord_sf(xlim = xlims, ylim = ylims) +
  scale_x_continuous(breaks = xbreaks) +
  theme_bw() +
  labs(subtitle = "(a) NDVI", fill = expression("[-]"~y^-1)) +
  theme(axis.title.x = element_blank(),
        axis.title.y = element_blank(),
        legend.key.width = unit(0.15, "in")) -> ndvi

ggplot(data) +
  geom_sf(data = africa, colour = "grey", fill = NA, alpha = 0.5) +
  geom_raster(aes(x = x, y = y, fill = pr_trend)) +
  scale_fill_continuous_diverging(limits = c(-0.1588118, 0.3441482),
                                  oob = scales::squish, na.value = NA, palette = "Blue-Red 3") +
  coord_sf(xlim = xlims, ylim = ylims) +
  scale_x_continuous(breaks = xbreaks) +
  theme_bw() +
  labs(subtitle = "(b) Precipitation", fill = expression("mm"~y^-1)) +
  theme(axis.title.x = element_blank(),
        axis.title.y = element_blank(),
        legend.key.width = unit(0.15, "in")) -> pr

ggplot(data) +
  geom_sf(data = africa, colour = "grey", fill = NA, alpha = 0.5) +
  geom_raster(aes(x = x, y = y, fill = tm_trend)) +
  scale_fill_continuous_diverging(limits = c(-0.008640864, 0.092846610),
                                  oob = scales::squish, na.value = NA, palette = "Blue-Red 3") +
  coord_sf(xlim = xlims, ylim = ylims) +
  scale_x_continuous(breaks = xbreaks) +
  theme_bw() +
  labs(subtitle = "(c) Temperature", fill = expression("0.1"~degree*C~y^-1)) +
  theme(axis.title.x = element_blank(),
        axis.title.y = element_blank(),
        legend.key.width = unit(0.15, "in")) -> tm

ggplot(data) +
  geom_sf(data = africa, colour = "grey", fill = NA, alpha = 0.5) +
  geom_raster(aes(x = x, y = y, fill = pet_trend)) +
  scale_fill_continuous_diverging(limits = c(-0.6805905, 0.8102751),
                                  oob = scales::squish, na.value = NA, palette = "Blue-Red 3") +
  coord_sf(xlim = xlims, ylim = ylims) +
  scale_x_continuous(breaks = xbreaks) +
  theme_bw() +
  labs(subtitle = "(d) Potential evapotransp.", fill = expression("0.1 mm"~y^-1)) +
  theme(axis.title.x = element_blank(),
        axis.title.y = element_blank(),
        legend.key.width = unit(0.15, "in")) -> pet

ggplot(data) +
  geom_sf(data = africa, colour = "grey", fill = NA, alpha = 0.5) +
  geom_raster(aes(x = x, y = y, fill = aet_trend)) +
  scale_fill_continuous_diverging(limits = c(-0.5677155, 0.9933489),
                                  oob = scales::squish, na.value = NA, palette = "Blue-Red 3") +
  coord_sf(xlim = xlims, ylim = ylims) +
  scale_x_continuous(breaks = xbreaks) +
  theme_bw() +
  labs(subtitle = "(e) Actual evapotransp.", fill = expression("0.1 mm"~y^-1)) +
  theme(axis.title.x = element_blank(),
        axis.title.y = element_blank(),
        legend.key.width = unit(0.15, "in")) -> aet

ggplot(data) +
  geom_sf(data = africa, colour = "grey", fill = NA, alpha = 0.5) +
  geom_raster(aes(x = x, y = y, fill = trend_long)) +
  scale_fill_continuous_diverging(limits = c(-32.82353, 72.33334),
                                  oob = scales::squish, na.value = NA, palette = "Blue-Red 3") +
  coord_sf(xlim = xlims, ylim = ylims) +
  scale_x_continuous(breaks = xbreaks) +
  theme_bw() +
  labs(subtitle = "(f) Assemblage trends", fill = "Trend [%]") +
  theme(axis.title.x = element_blank(),
        axis.title.y = element_blank(),
        legend.key.width = unit(0.15, "in")) -> pop


ndvi + pr + tm + pet + aet + pop + plot_layout(ncol = 3) +
  plot_annotation(title = "Environmental and species assemblage trends")
ggsave(filename = "data/processed/plots/environmental_trends.pdf", device = "pdf", width = 12, height = 6.21, units = "in")9.2 Environmental variability
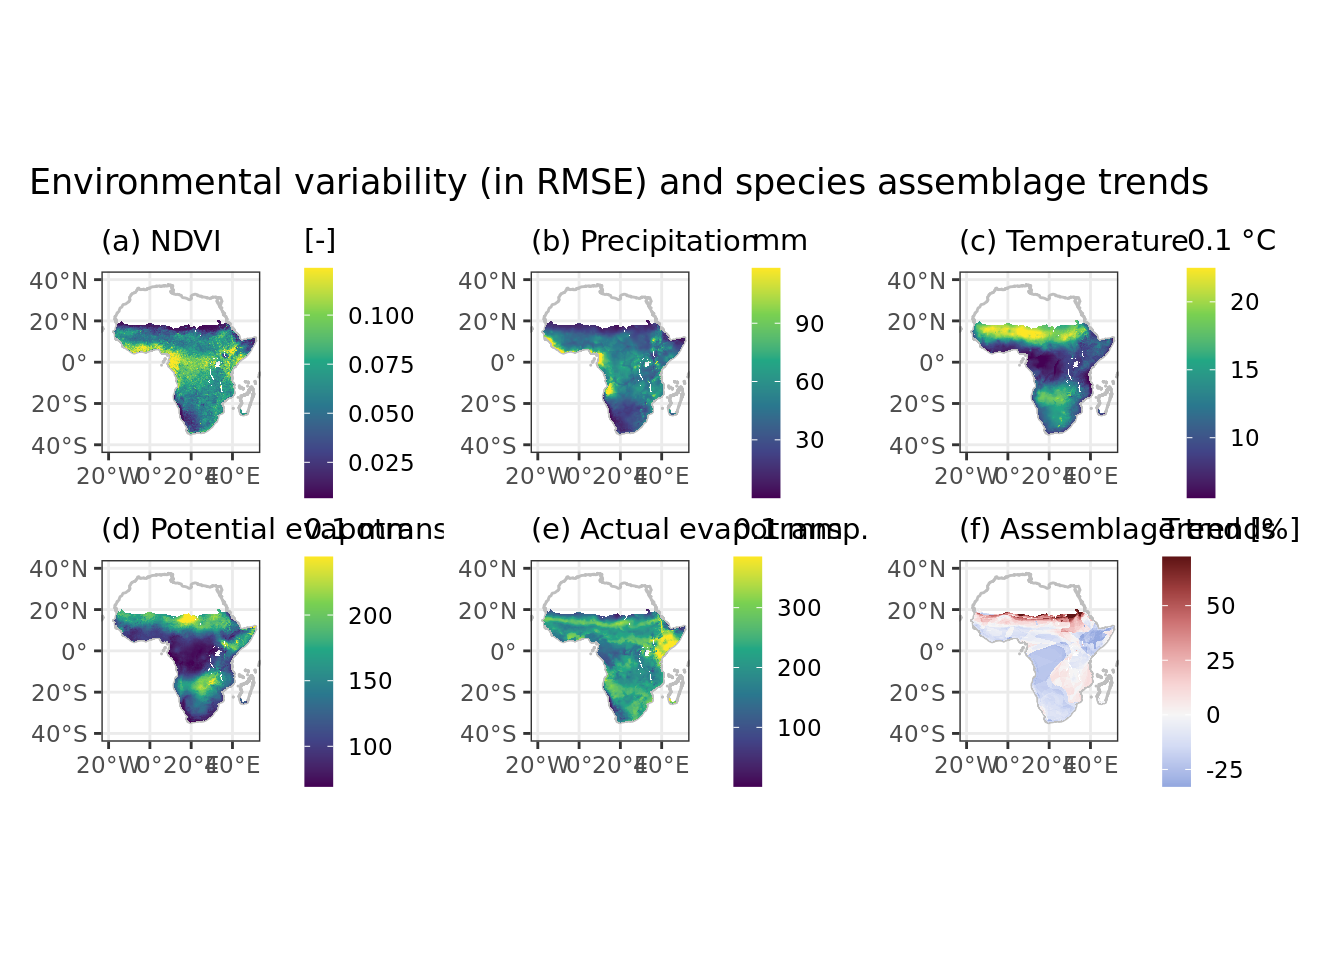
Color scales are mapped to (ie limited by) 1% and 99% quantiles, but for now I seem unable to calculate this on the fly in ggplot so these values are hard-coded and should be changed manually when the dataset changes.
total_unpred <- function(data) {
  out <- range01(scale(data["ndvi_resid"]), na.rm = TRUE) + range01(scale(data["pr_resid"]), na.rm = TRUE) +
    range01(scale(data["tm_resid"]), na.rm = TRUE) + range01(scale(data["pet_resid"]), na.rm = TRUE) +
    range01(scale(data["aet_resid"]), na.rm = TRUE)
  as.matrix(out)
}

data["total"] <- total_unpred(data)

ggplot() +
  geom_sf(data = africa, colour = "grey", fill = NA, alpha = 0.5) +
  geom_raster(aes(x = x, y = y, fill = ndvi_resid), data = data) +
  # scale_fill_continuous_sequential(limits = c(0.006920418, 0.123886703),
  #                                  oob = scales::squish, na.value = NA, palette = "Greens") +
  scale_fill_viridis_c(limits = c(0.006920418, 0.123886703), oob = scales::squish, na.value = NA) +
  coord_sf(xlim = xlims, ylim = ylims) +
  scale_x_continuous(breaks = xbreaks) +
  theme_bw() +
  labs(subtitle = "(a) NDVI", fill = "[-]") +
  theme(axis.title.x = element_blank(),
        axis.title.y = element_blank(),
        legend.key.width = unit(0.15, "in"))-> ndvi

ggplot() +
  geom_sf(data = africa, colour = "grey", fill = NA, alpha = 0.5) +
  geom_raster(aes(x = x, y = y, fill = pr_resid), data = data) +
  # scale_fill_continuous_sequential(limits = c(0.1481013, 118.3143118),
  #                                  oob = scales::squish, na.value = NA, palette = "Blues") +
  scale_fill_viridis_c(limits = c(0.1481013, 118.3143118), oob = scales::squish, na.value = NA) +
  coord_sf(xlim = xlims, ylim = ylims) +
  scale_x_continuous(breaks = xbreaks) +
  theme_bw() +
  labs(subtitle = "(b) Precipitation", fill = "mm") +
  theme(axis.title.x = element_blank(),
        axis.title.y = element_blank(),
        legend.key.width = unit(0.15, "in")) -> pr

ggplot() +
  geom_sf(data = africa, colour = "grey", fill = NA, alpha = 0.5) +
  geom_raster(aes(x = x, y = y, fill = tm_resid), data = data) +
  # scale_fill_continuous_sequential(limits = c(5.577115, 22.475821),
  #                                  oob = scales::squish, na.value = NA, palette = "Reds") +
  scale_fill_viridis_c(limits = c(5.577115, 22.475821), oob = scales::squish, na.value = NA) +
  coord_sf(xlim = xlims, ylim = ylims) +
  scale_x_continuous(breaks = xbreaks) +
  theme_bw() +
  labs(subtitle = "(c) Temperature", fill = expression("0.1"~degree*C)) +
  theme(axis.title.x = element_blank(),
        axis.title.y = element_blank(),
        legend.key.width = unit(0.15, "in")) -> tm

ggplot() +
  geom_sf(data = africa, colour = "grey", fill = NA, alpha = 0.5) +
  geom_raster(aes(x = x, y = y, fill = pet_resid), data = data) +
  # scale_fill_continuous_sequential(limits = c(69.39295, 244.31387),
  #                                  oob = scales::squish, na.value = NA, palette = "Oranges") +
  scale_fill_viridis_c(limits = c(69.39295, 244.31387), oob = scales::squish, na.value = NA) +
  coord_sf(xlim = xlims, ylim = ylims) +
  scale_x_continuous(breaks = xbreaks) +
  theme_bw() +
  labs(subtitle = "(d) Potential evapotransp.", fill = "0.1 mm") +
  theme(axis.title.x = element_blank(),
        axis.title.y = element_blank(),
        legend.key.width = unit(0.15, "in")) -> pet

ggplot() +
  geom_sf(data = africa, colour = "grey", fill = NA, alpha = 0.5) +
  geom_raster(aes(x = x, y = y, fill = aet_resid), data = data) +
  # scale_fill_continuous_sequential(limits = c(1.212078, 384.816440),
  #                                  oob = scales::squish, na.value = NA, palette = "Oranges") +
  scale_fill_viridis_c(limits = c(1.212078, 384.816440), oob = scales::squish, na.value = NA) +
  coord_sf(xlim = xlims, ylim = ylims) +
  scale_x_continuous(breaks = xbreaks) +
  theme_bw() +
  labs(subtitle = "(e) Actual evapotransp.", fill = "0.1 mm") +
  theme(axis.title.x = element_blank(),
        axis.title.y = element_blank(),
        legend.key.width = unit(0.15, "in")) -> aet

ggplot(data) +
  geom_sf(data = africa, colour = "grey", fill = NA, alpha = 0.5) +
  geom_raster(aes(x = x, y = y, fill = trend_long)) +
  scale_fill_continuous_diverging(limits = c(-32.82353, 72.33334),
                                  oob = scales::squish, na.value = NA, palette = "Blue-Red 3") +
  coord_sf(xlim = xlims, ylim = ylims) +
  scale_x_continuous(breaks = xbreaks) +
  theme_bw() +
  labs(subtitle = "(f) Assemblage trends", fill = "Trend [%]") +
  theme(axis.title.x = element_blank(),
        axis.title.y = element_blank(),
        legend.key.width = unit(0.15, "in")) -> popop

ndvi + pr + tm + pet + aet + pop + plot_layout(ncol = 3) +
  plot_annotation(title = "Environmental variability (in RMSE) and species assemblage trends")
ggsave(filename = "data/processed/plots/environmental_predictability.pdf", device = "pdf", width = 12, height = 6.21, units = "in")As ggplot2 stores the last figure in cache, and memory during knitting of this document/website is limited, we have to empty the cache now explicitly.
ggplot2::set_last_plot(NULL)
gc()
## used (Mb) gc trigger (Mb) max used (Mb)
## Ncells 2085322 111.4 3836272 204.9 3836272 204.9
## Vcells 136554913 1041.9 429298991 3275.3 429293841 3275.3